Ptarmigan wrote:Michael is more intense than the most intense Texas hurricane, the 1886 Indianola Hurricane. It had a central pressure of 925 millibars.
I thought the wind and damage at Lockport was bad. Storm surge with Michael was higher than expected and rose violently, rising to roof level in Mexico Beach. The winds more blustery than Harvey. Panama Beach, Tyndal AFB, Mexico Beach, St Joe's were absolutely nuked. Anyone who saw Brett Adair's video should have a much healthier respect for Mother Nature.
There was too much complacency...while Florence's flooding was catastrophic it's weakening to a CAT 1 on landfall reduced public's attention span on wind damage, surge.
Michael was the real deal.
Last edited by DoctorMu on Thu Oct 11, 2018 11:41 pm, edited 1 time in total.
Very true. I've spoken to many folks who live on or near the coast who said they will never evacuate for "just a cat 2 or 3", even though we are talking about winds over 100 mph. It blows my mind.
Michael came in so strong that it was still a cat 3 100+ miles inland. How would folks in Conroe on up towards College Station like to be dealing with that if such a strong one hit us?
Clearly we will see heartbreaking devastation across the Panama City to Apalachicola Region and inland where it is heavily forested through Tallahassee in to SW Georgia. Sadly it appears almost half the folks near the Coast did not evacuate. David Paul had a graphic up yesterday of a CAT 3 inland 114 miles in SE Texas as Michael did. Sobering to say the least and why we 'preach' to heed warnings!
Our weekend and early next week weather looks to remain active after a very pleasant morning with cool and dry Northerly breezes. Sergio will move very quickly ENE and be over the Texas Panhandle Saturday spreading heavy rain and storms. In is wake a very strong Fall Cold Front will race S and E with some snow in the Panhandle Sunday night into Monday morning. It does appear we will not clear out behind the front as a very noisy sub tropical jet will be overhead with damp/chilly rain and drizzle continuing into Tuesday hold temperature in check across the Region. Night time lows are held in check by cloud cover, but high temperatures may struggle to reach the low 60's...if not the low 50's for areas NW/N/NE of Metro Houston.
Attachments
Carla/Alicia/Jerry(In The Eye)/Michelle/Charley/Ivan/Dennis/Katrina/Rita/Wilma/Humberto/Ike/Harvey
Member: National Weather Association
Facebook.com/Weather Infinity
Twitter @WeatherInfinity
srainhoutx wrote:Clearly we will see heartbreaking devastation across the Panama City to Apalachicola Region and inland where it is heavily forested through Tallahassee in to SW Georgia. Sadly it appears almost half the folks near the Coast did not evacuate. David Paul had a graphic up yesterday of a CAT 3 inland 114 miles in SE Texas as Michael did. Sobering to say the least and why we 'preach' to heed warnings!
Our weekend and early next week weather looks to remain active after a very pleasant morning with cool and dry Northerly breezes. Sergio will move very quickly ENE and be over the Texas Panhandle Saturday spreading heavy rain and storms. In is wake a very strong Fall Cold Front will race S and E with some snow in the Panhandle Sunday night into Monday morning. It does appear we will not clear out behind the front as a very noisy sub tropical jet will be overhead with damp/chilly rain and drizzle continuing into Tuesday hold temperature in check across the Region. Night time lows are held in check by cloud cover, but high temperatures may struggle to reach the low 60's...if not the low 50's for areas NW/N/NE of Metro Houston.
The staff at the National Hurricane Center work tirelessly providing life-saving information to the public. During disasters like Hurricane Michael, we rightfully thank first responders, emergency managers, and volunteers. They do critical work on the front lines of storm recovery and assistance. However, I am not sure people realize the mental stress meteorologists deal with as conveying life-altering information.
Has everyone had a chance to step outside this morning??? OMG......THIS is the day I look forward to more than any other...that first day you can actually feel the difference. Like the changing of the guard......
Early images of the damage by one of the strongest hurricanes to ever strike the US coast indicate that a large majority of the damage was contained to the eyewall area of the hurricane. The heaviest of the damage extends from Downtown Panama City (not Panama City Beach) to Tyndall AFB and then Mexico Beach. Downtown Panama City was within the western eyewall of the hurricane, while Panama City Beach was not within the eyewall. Extreme damage occurred from both surge and wind in the eastern eyewall at Mexico Beach.
The majority of the damage over a large section of Panama City and Tyndall AFB looks to be similar to an EF 1 or EF 2 tornado with streaks of EF 3 damage. Michael showed extensive meso vortex imagery during landfall in its eyewall and these small vortices likely accelerated the wind speeds 20-30mph over the background wind in very small streaks. This produces small almost tornado like damage patterns within the overall hurricane eyewall damage pattern.
There has been little information from both Mexico Beach and Port St Joe which took the direct impact of the eastern eyewall.
Comparison of Harvey to Michael:
Wind damage potential increases at an exponential rate on a power scale of 2^8. For example a 100 mph wind produces 10 times more damage than a 75mph wind however a 125mph wind produces 60 times more damage potential than a 75mph wind.
Harvey made landfall at Port Aransas with sustained winds of 130mph and Michael made landfall with sustained winds of 155mph. While the wind speed at landfall of Michael was only 25mph stronger than Harvey, Michael’s damage potential was 251 times greater than Harvey and 333 times greater than a 75mph hurricane. Even a very slight increase in wind between 155mph and 160mph produce a damage potential of 96 times greater damage. Radar data yesterday was showing wind speeds of 175-177mph just above the surface as Michael was making landfall and some of that energy was likely brought to the surface in gusts. A 170mph wind would produce a damage potential of 615 times more than a 130mph wind.
As bad as the damage was at Rockport and Port Aransas, you can clearly see that the wind damage potential from Michael was exceptional. Even with extremely strict building codes across FL, many of the structures could not withstand that type of wind load in the eyewall area of Michael.
The good news is that Michael was moving fairly fast which limited the sustained eyewall winds to about 30-40 minutes unlike Harvey which battered areas for 6-8 hours with very strong winds. This fast forward motion also resulted in Michael maintaining category 3 intensity well inland into southwest Georgia where a 115mph wind gust was reported.
Mexico Beach:
The attachment 10112018 Jeff 1 untitled.png is no longer available
The attachment 10112018 Jeff 2 untitled.png is no longer available
10112018 Jeff 3 untitled.png (138.09 KiB) Viewed 9157 times
10112018 Jeff 5 untitled.png (414.32 KiB) Viewed 9157 times
Panama City:
10112018 Jeff 6 untitled.png (110.44 KiB) Viewed 9157 times
St. George Island:
Port St Joe:
10112018 Jeff 19 untitled.png (222.66 KiB) Viewed 9157 times
Carla/Alicia/Jerry(In The Eye)/Michelle/Charley/Ivan/Dennis/Katrina/Rita/Wilma/Humberto/Ike/Harvey
Member: National Weather Association
Facebook.com/Weather Infinity
Twitter @WeatherInfinity
If Michael had been moving a few miles per hour slower in the 24hrs prior to landfall the wind field would have grown significantly, storm surge would have been higher and the extreme damage more widespread. Would be interesting to see modeling done for such a scenario.
Mid and high level clouds are streaming in from the West this afternoon ahead of TS Sergio rapidly closing in on the Central Baja Peninsula. Sergio appears to keep some of its tropical characteristics as it exits Northern Mexico into Southern New Mexico/Texas Panhandle Friday evening/Saturday morning as a Tropical Depression. I deep trough is digging S across the Great Basin that should keep Sergio trekking ENE as a strong low pressure system develops across portions of the Central/Southern Rockies Saturday night into Sunday ushering in our strong Fall Cold Front. A pesky coastal trough of low pressure looks likely after the front clears the Coast and potentially a deeper area of low pressure could develop along the Frontal Boundary in the Bay of Campeche/Western Gulf the first half of next week keeping our sensible weather unsettled. The upper trough should build over the Eastern United States with a Ridge in the West keeping a NW flow in the upper levels. A secondary surge of very shallow colder air may arrive later next week keeping temperatures well below climatology for this time of year.
Attachments
Carla/Alicia/Jerry(In The Eye)/Michelle/Charley/Ivan/Dennis/Katrina/Rita/Wilma/Humberto/Ike/Harvey
Member: National Weather Association
Facebook.com/Weather Infinity
Twitter @WeatherInfinity
srainhoutx wrote:Clearly we will see heartbreaking devastation across the Panama City to Apalachicola Region and inland where it is heavily forested through Tallahassee in to SW Georgia. Sadly it appears almost half the folks near the Coast did not evacuate. David Paul had a graphic up yesterday of a CAT 3 inland 114 miles in SE Texas as Michael did. Sobering to say the least and why we 'preach' to heed warnings!
Our weekend and early next week weather looks to remain active after a very pleasant morning with cool and dry Northerly breezes. Sergio will move very quickly ENE and be over the Texas Panhandle Saturday spreading heavy rain and storms. In is wake a very strong Fall Cold Front will race S and E with some snow in the Panhandle Sunday night into Monday morning. It does appear we will not clear out behind the front as a very noisy sub tropical jet will be overhead with damp/chilly rain and drizzle continuing into Tuesday hold temperature in check across the Region. Night time lows are held in check by cloud cover, but high temperatures may struggle to reach the low 60's...if not the low 50's for areas NW/N/NE of Metro Houston.
Category 3 far inland would be really bad anywhere. The area looks like a nuke went off.
The death toll is something I do not want to even think about.
The overnight guidance continues to advertise an unsettled and changeable weather pattern developing this weekend extending into next week. EPAC TS Sergio moved inland over the Central Baja Peninsula this morning and is moving rapidly ENE caught up in a deep Western Upper Trough. The WPC Excessive Rainfall Outlook suggest a Slight to Moderate Risk for Excessive Rainfall well to the N of SE Texas extending from Northern Mexico to Southern New Mexico, portions of the Panhandle/Permian Basin into N Central Texas and Southern Oklahoma over the next couple of days. A strong shortwave trough is diving SE out Alberta Canada this morning and that is where our First Fall Cold Front is organizing. As the remnants of Sergio move ENE to NE on Sunday, the Cold Front enters the Southern Rockies and the Southern Plains and continues to push S Sunday night/Monday morning and off the Coast during the Monday. Snow, some heavy develops over the higher elevations of the Southern Rockies and the Denver Area Sunday. Snow will continue to develop in the Panhandle and possible mixing with some rain in portions of the Permian Basin. This Cold Front will be very shallow with cold air trapped well below 850mb or about a mile up. The coldest air likely will only extend upward to about 1500 to 2000 ft and with a strong sub tropical jet flow over Texas, over running light rain and drizzle appears likely Monday, Tuesday and Wednesday possibly extending into late next week. The fly in the ointment is an area of low pressure developing at the tail end of the front in the Western Gulf and a Coastal trough of low pressure. We'll need to monitor and "fine tune" the sensible weather forecast early next week as we get a bit closer to that time frame. Some chilly air is coming, but appears we will not dry out behind the front.
Attachments
Carla/Alicia/Jerry(In The Eye)/Michelle/Charley/Ivan/Dennis/Katrina/Rita/Wilma/Humberto/Ike/Harvey
Member: National Weather Association
Facebook.com/Weather Infinity
Twitter @WeatherInfinity
Amplified upper air pattern post Michael and on the backside of approaching TS Sergio into Baja will drive a strong cold front across TX on Monday. This will be a significant cold front with strong cold air advection.
Remains of Sergio will move across TX today into Saturday with widespread rainfall focusing mainly across north Texas. Lower pressures with this feature will result in a return of onshore flow over SE TX and a rise in moisture and humidity levels this weekend.
Strong front will begin to surge down the plains on Sunday as the remains of Sergio depart to the east and this front will arrive into TX Sunday night and blast off the coast sometime on Monday. Strong cold air advection will onset post front with temperatures rapidly falling behind the front. Temperatures in the 70’s and 80’s ahead of the front will fall rapidly into the 60’s behind the front and maybe even the upper 50’s during the day on Monday. Frontal slope is shallow (only around 2000-3000ft thick and SW winds above that layer will bring moisture back over the surface cool dome resulting in cloudy conditions with periods of rain Tuesday-Thursday. Cold air advection coupled with clouds and rain will keep temperatures cool to cold during this period with lows in the 50’s and highs possibly only near 60. Gusty north winds will make it feel much colder.
Carla/Alicia/Jerry(In The Eye)/Michelle/Charley/Ivan/Dennis/Katrina/Rita/Wilma/Humberto/Ike/Harvey
Member: National Weather Association
Facebook.com/Weather Infinity
Twitter @WeatherInfinity
There are growing indications that cooler weather will continue into late October. It appears that the next couple of days will end our Summer like pattern as the days grow shorter and Fall fully arrives.
Attachments
Carla/Alicia/Jerry(In The Eye)/Michelle/Charley/Ivan/Dennis/Katrina/Rita/Wilma/Humberto/Ike/Harvey
Member: National Weather Association
Facebook.com/Weather Infinity
Twitter @WeatherInfinity
srainhoutx wrote:There are growing indications that cooler weather will continue into late October. It appears that the next couple of days will end our Summer like pattern as the days grow shorter and Fall fully arrives.
Surge in the DP this afternoon. The morning and midday felt great though.
Sergio moisture and noisy SJT will give us brisk, overrunning conditions all next week. Hoping for some sun after that.
Clouds may abate next Saturday (10/20) with not rain on the long-term through the end of the month while remaining cooler than normal...as will the eastern half of the country.
The Canadian if anything is even more robust in cool temps. They are more optimistic for rain breaking up on Thursday, instead of Saturday. We'll see.
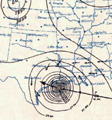
Our SE Texas neighbor shared his decade + experience flying as 53rd Reservist. These images were taken as Michael made landfall. The flight was extremely turbulent and the Eyewall was more like a "gun barrel" than a Stadium.
Attachments
Carla/Alicia/Jerry(In The Eye)/Michelle/Charley/Ivan/Dennis/Katrina/Rita/Wilma/Humberto/Ike/Harvey
Member: National Weather Association
Facebook.com/Weather Infinity
Twitter @WeatherInfinity
srainhoutx wrote:There are growing indications that cooler weather will continue into late October. It appears that the next couple of days will end our Summer like pattern as the days grow shorter and Fall fully arrives.
Surge in the DP this afternoon. The morning and midday felt great though.
Sergio moisture and noisy SJT will give us brisk, overrunning conditions all next week. Hoping for some sun after that.
Clouds may abate next Saturday (10/20) with not rain on the long-term through the end of the month while remaining cooler than normal...as will the eastern half of the country.
The Canadian if anything is even more robust in cool temps. They are more optimistic for rain breaking up on Thursday, instead of Saturday. We'll see.
There may be one or two more EPAC hurricanes that could play a role in our weather the rest of the month.
Probably would play more of a roll in WTX and NTX than our area, but we’ll see.
You are absolutely right Cpv17. We are carefully watch the extended range. You've missed out on the rainfall many us of us have seen. El Nino is slowly developing. It appears we are in for an active late Fall and Winter Season.
Carla/Alicia/Jerry(In The Eye)/Michelle/Charley/Ivan/Dennis/Katrina/Rita/Wilma/Humberto/Ike/Harvey
Member: National Weather Association
Facebook.com/Weather Infinity
Twitter @WeatherInfinity
I’m not quite sure how accurate the HRRR model is, but I always see a lot of people talking about it. Anyways, it seems to be keying in on Wharton, Jackson, & Colorado counties this morning.