
This Week's ENSO
Niño 4 1.2ºC
Niño 3.4 1.5ºC
Niño 3 1.4ºC
Niño 1+2 0.9ºC
http://www.cpc.noaa.gov/products/analys ... ts-web.pdf
All regions cooled. El Nino is fading slowly.
ENSO Updates
-
Ptarmigan
- Statistical Specialist

- Posts: 4511
- Joined: Wed Feb 03, 2010 7:20 pm
- Contact:
-
Ptarmigan
- Statistical Specialist
- Posts: 4511
- Joined: Wed Feb 03, 2010 7:20 pm
- Contact:
This Week's ENSO
Niño 4 1.1ºC
Niño 3.4 1.5ºC
Niño 3 1.6ºC
Niño 1+2 1.5ºC
http://www.cpc.noaa.gov/products/analys ... ts-web.pdf
Region 1+2 and 3 warmed. Region 3.4 remains the same, while Region 4 cooled.
Niño 4 1.1ºC
Niño 3.4 1.5ºC
Niño 3 1.6ºC
Niño 1+2 1.5ºC
http://www.cpc.noaa.gov/products/analys ... ts-web.pdf
Region 1+2 and 3 warmed. Region 3.4 remains the same, while Region 4 cooled.
-
Ptarmigan
- Statistical Specialist
- Posts: 4511
- Joined: Wed Feb 03, 2010 7:20 pm
- Contact:
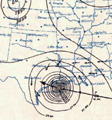
Subsurface cross from April 1973. It is from ECMWF Ocean Reanalysis.

1973-1974 is one of the strongest La Nina on record.
1973-1974 is one of the strongest La Nina on record.
-
Ptarmigan
- Statistical Specialist
- Posts: 4511
- Joined: Wed Feb 03, 2010 7:20 pm
- Contact:
This Week's ENSO
Niño 4 0.9ºC
Niño 3.4 1.3ºC
Niño 3 1.4ºC
Niño 1+2 1.3ºC
http://www.cpc.noaa.gov/products/analys ... ts-web.pdf
All regions cooled as El Nino is slowly fading.
Niño 4 0.9ºC
Niño 3.4 1.3ºC
Niño 3 1.4ºC
Niño 1+2 1.3ºC
http://www.cpc.noaa.gov/products/analys ... ts-web.pdf
All regions cooled as El Nino is slowly fading.
-
Ptarmigan
- Statistical Specialist
- Posts: 4511
- Joined: Wed Feb 03, 2010 7:20 pm
- Contact:
Last Week's ENSO
Niño 4 0.8ºC
Niño 3.4 1.3ºC
Niño 3 1.2ºC
Niño 1+2 0.1ºC
http://www.cpc.noaa.gov/products/analys ... ts-web.pdf
Region 1+2 cooled very rapidly. Region 3 cooled as well. Region 3.4 is the same, while Region 4 warmed.
Region 1+2 can change rapidly as it is off the coast of South America.
Niño 4 0.8ºC
Niño 3.4 1.3ºC
Niño 3 1.2ºC
Niño 1+2 0.1ºC
http://www.cpc.noaa.gov/products/analys ... ts-web.pdf
Region 1+2 cooled very rapidly. Region 3 cooled as well. Region 3.4 is the same, while Region 4 warmed.
Region 1+2 can change rapidly as it is off the coast of South America.
Last edited by Ptarmigan on Mon Apr 18, 2016 10:24 pm, edited 1 time in total.
-
Ptarmigan
- Statistical Specialist
- Posts: 4511
- Joined: Wed Feb 03, 2010 7:20 pm
- Contact:
Latest Southern Oscillation Index values
https://www.longpaddock.qld.gov.au/seas ... tionindex/
Average for last 30 days -14.21
Average for last 90 days -13.26
Daily contribution to SOI calculation -19.83
SOI is negative again. This can put a wrench of La Nina.
ENSO Precipitation Index (ESPI)
http://trmm.gsfc.nasa.gov//trmm_rain/Ev ... y_day.html
Last 30 Days is 0.93
ESPI is decreasing like La Nina.
-
Ptarmigan
- Statistical Specialist
- Posts: 4511
- Joined: Wed Feb 03, 2010 7:20 pm
- Contact:
This Week's ENSO
Niño 4 0.8ºC
Niño 3.4 1.1ºC
Niño 3 0.6ºC
Niño 1+2 -0.6ºC
http://www.cpc.noaa.gov/products/analys ... ts-web.pdf
Region 1+2, 3, and 3.4 have cooled. Region 4 is the same.
Niño 4 0.8ºC
Niño 3.4 1.1ºC
Niño 3 0.6ºC
Niño 1+2 -0.6ºC
http://www.cpc.noaa.gov/products/analys ... ts-web.pdf
Region 1+2, 3, and 3.4 have cooled. Region 4 is the same.
-
Ptarmigan
- Statistical Specialist
- Posts: 4511
- Joined: Wed Feb 03, 2010 7:20 pm
- Contact:
Latest Southern Oscillation Index values
https://www.longpaddock.qld.gov.au/seas ... tionindex/
Average for last 30 days -17.26
Average for last 90 days -13.57
Daily contribution to SOI calculation -36.27
The SOI dropped last week despite waters cooling. Atmosphere has not reacted in the same manner.
ENSO Precipitation Index (ESPI)
http://trmm.gsfc.nasa.gov//trmm_rain/Ev ... y_day.html
Last 30 Days is 1.12
ESPI increased, which reflects the complexity of El Nino and La Nina.
-
Ptarmigan
- Statistical Specialist
- Posts: 4511
- Joined: Wed Feb 03, 2010 7:20 pm
- Contact:
This Week's ENSO
Niño 4 0.9ºC
Niño 3.4 0.8ºC
Niño 3 0.4ºC
Niño 1+2 -0.3ºC
http://www.cpc.noaa.gov/products/analys ... ts-web.pdf
Region 1+2 and 4 have warmed, while Region 3 and 3.4 have cooled.
Niño 4 0.9ºC
Niño 3.4 0.8ºC
Niño 3 0.4ºC
Niño 1+2 -0.3ºC
http://www.cpc.noaa.gov/products/analys ... ts-web.pdf
Region 1+2 and 4 have warmed, while Region 3 and 3.4 have cooled.
-
Ptarmigan
- Statistical Specialist
- Posts: 4511
- Joined: Wed Feb 03, 2010 7:20 pm
- Contact:
https://www.longpaddock.qld.gov.au/seas ... tionindex/
Average for last 30 days -18.25
Average for last 90 days -13.85
Daily contribution to SOI calculation -27.33
The SOI rised from last week despite waters warming. It likely contributed to the slight warming of Region 4. Region 1+2 is near land, so it is more volatile. Atmosphere has not reacted in the same manner.
ENSO Precipitation Index (ESPI)
http://trmm.gsfc.nasa.gov//trmm_rain/Ev ... y_day.html
Last 30 Days is 0.95
ESPI dropped, which reflects the complexity of El Nino and La Nina.
Last edited by Ptarmigan on Tue May 10, 2016 10:15 pm, edited 1 time in total.
-
Ptarmigan
- Statistical Specialist
- Posts: 4511
- Joined: Wed Feb 03, 2010 7:20 pm
- Contact:
This Week's ENSO
Niño 4 0.8ºC
Niño 3.4 0.8ºC
Niño 3 0.4ºC
Niño 1+2 0.4ºC
http://www.cpc.noaa.gov/products/analys ... ts-web.pdf
Region 1+2 had warmed. Region 3 and 3.4 have stayed the same, while Region 4 has cooled. Region 1+2 is more prone to swings due to being the coastal area of South America.
Niño 4 0.8ºC
Niño 3.4 0.8ºC
Niño 3 0.4ºC
Niño 1+2 0.4ºC
http://www.cpc.noaa.gov/products/analys ... ts-web.pdf
Region 1+2 had warmed. Region 3 and 3.4 have stayed the same, while Region 4 has cooled. Region 1+2 is more prone to swings due to being the coastal area of South America.
-
Ptarmigan
- Statistical Specialist
- Posts: 4511
- Joined: Wed Feb 03, 2010 7:20 pm
- Contact:
https://www.longpaddock.qld.gov.au/seas ... tionindex/
Average for last 30 days -12.62
Average for last 90 days -13.88
Daily contribution to SOI calculation 8.14
The SOI rised from last week.
ENSO Precipitation Index (ESPI)
http://trmm.gsfc.nasa.gov//trmm_rain/Ev ... y_day.html
Last 30 Days is 0.90
ESPI dropped, which reflects the complexity of El Nino and La Nina.
-
Ptarmigan
- Statistical Specialist
- Posts: 4511
- Joined: Wed Feb 03, 2010 7:20 pm
- Contact:
This Week's ENSO
Niño 4 0.6ºC
Niño 3.4 0.6ºC
Niño 3 0.4ºC
Niño 1+2 0.5ºC
http://www.cpc.noaa.gov/products/analys ... ts-web.pdf
Region 1+2 warmed, while Region 3 stayed the same. Region 3.4 and 4 cooled.
Niño 4 0.6ºC
Niño 3.4 0.6ºC
Niño 3 0.4ºC
Niño 1+2 0.5ºC
http://www.cpc.noaa.gov/products/analys ... ts-web.pdf
Region 1+2 warmed, while Region 3 stayed the same. Region 3.4 and 4 cooled.
-
Ptarmigan
- Statistical Specialist
- Posts: 4511
- Joined: Wed Feb 03, 2010 7:20 pm
- Contact:
April PDO went up to 2.62 despite El Nino weakening. This complicates La Nina forecasting.
http://research.jisao.washington.edu/pdo/PDO.latest
http://research.jisao.washington.edu/pdo/PDO.latest
-
Ptarmigan
- Statistical Specialist
- Posts: 4511
- Joined: Wed Feb 03, 2010 7:20 pm
- Contact:
This Week's ENSO
Niño 4 0.6ºC
Niño 3.4 0.2ºC
Niño 3 -0.1ºC
Niño 1+2 0.2ºC
http://www.cpc.noaa.gov/products/analys ... ts-web.pdf
All regions cooled, except for Region 4.
Niño 4 0.6ºC
Niño 3.4 0.2ºC
Niño 3 -0.1ºC
Niño 1+2 0.2ºC
http://www.cpc.noaa.gov/products/analys ... ts-web.pdf
All regions cooled, except for Region 4.
-
Ptarmigan
- Statistical Specialist
- Posts: 4511
- Joined: Wed Feb 03, 2010 7:20 pm
- Contact:
https://www.longpaddock.qld.gov.au/seas ... tionindex/
Average for last 30 days -2.10
Average for last 90 days -10.03
Daily contribution to SOI calculation 8.75
The SOI is in positive territory.
ENSO Precipitation Index (ESPI)
http://trmm.gsfc.nasa.gov//trmm_rain/Ev ... y_day.html
Last 30 Days is 0.46
ESPI dropped, which reflects the complexity of El Nino and La Nina.
-
Ptarmigan
- Statistical Specialist
- Posts: 4511
- Joined: Wed Feb 03, 2010 7:20 pm
- Contact:
This Week's ENSO
Niño 4 0.6ºC
Niño 3.4 -0.1ºC
Niño 3 -0.3ºC
Niño 1+2 0.2ºC
http://www.cpc.noaa.gov/products/analys ... ts-web.pdf
Region 1+2 and 4 stay the same. Region 3 and 3.4 cooled.
Niño 4 0.6ºC
Niño 3.4 -0.1ºC
Niño 3 -0.3ºC
Niño 1+2 0.2ºC
http://www.cpc.noaa.gov/products/analys ... ts-web.pdf
Region 1+2 and 4 stay the same. Region 3 and 3.4 cooled.
-
Ptarmigan
- Statistical Specialist
- Posts: 4511
- Joined: Wed Feb 03, 2010 7:20 pm
- Contact:
This Week's ENSO
Niño 4 0.5ºC
Niño 3.4 -0.2ºC
Niño 3 -0.3ºC
Niño 1+2 0.0ºC
http://www.cpc.noaa.gov/products/analys ... ts-web.pdf
Region 1+2, 3.4, and 4 have cooled. Region 3 has not changed.
Niño 4 0.5ºC
Niño 3.4 -0.2ºC
Niño 3 -0.3ºC
Niño 1+2 0.0ºC
http://www.cpc.noaa.gov/products/analys ... ts-web.pdf
Region 1+2, 3.4, and 4 have cooled. Region 3 has not changed.
-
Ptarmigan
- Statistical Specialist
- Posts: 4511
- Joined: Wed Feb 03, 2010 7:20 pm
- Contact:
Latest Southern Oscillation Index values
https://www.longpaddock.qld.gov.au/seas ... tionindex/
Average for last 30 days 1.48
Average for last 90 days -6.41
Daily contribution to SOI calculation -18.49
The SOI in negative territory. This complicates La Nina with a warm PDO.
ENSO Precipitation Index (ESPI)
http://trmm.gsfc.nasa.gov//trmm_rain/Ev ... y_day.html
Last 30 Days is -0.60
ESPI in negative territory.
-
Ptarmigan
- Statistical Specialist
- Posts: 4511
- Joined: Wed Feb 03, 2010 7:20 pm
- Contact:
This Week's ENSO
Niño 4 0.6ºC
Niño 3.4 0.1ºC
Niño 3 0.0ºC
Niño 1+2 0.6ºC
http://www.cpc.noaa.gov/products/analys ... ts-web.pdf
All regions warmed. This shows how complicate forecasting El Nino or La Nina is.
Niño 4 0.6ºC
Niño 3.4 0.1ºC
Niño 3 0.0ºC
Niño 1+2 0.6ºC
http://www.cpc.noaa.gov/products/analys ... ts-web.pdf
All regions warmed. This shows how complicate forecasting El Nino or La Nina is.