
I think most are pretty tired and still getting final preparations in. Plus not many models to look at right now/ we are getting close to just nowcasting.
August 2020:
-
Andrew
- Site Admin

- Posts: 3440
- Joined: Wed Feb 03, 2010 9:46 pm
- Location: North-West Houston
- Contact:
For Your Infinite Source For All Things Weather Visit Our Facebook
-
AtascocitaWX
- Posts: 92
- Joined: Mon Jun 19, 2017 3:29 pm
- Location: Atascocita,Tx
- Contact:
Probably because latest trend is East and some Mets are saying we are in the clear. As long as we are still within 120 miles any unforeseen movement can change landfall.
Pretty much. Lots of running around today and now just in "see what the new situation is as of Wednesday morning" Models are gonna say one thing and the storm is close enough to worry about whats happening now as you said.
You may be in the clear for a direct hit but rest assured there will be impacts.AtascocitaWX wrote: ↑Tue Aug 25, 2020 7:25 pmProbably because latest trend is East and some Mets are saying we are in the clear. As long as we are still within 120 miles any unforeseen movement can change landfall.
-
Stormlover2020
- Posts: 457
- Joined: Mon Jun 01, 2020 6:04 pm
- Contact:
Time to watch hrr now
18z euro back east to the border.
Since it is momentarily quiet, I'll ask what I've been wondering for awhile:
Why is there a Hurricane Central sub forum if the hurricane thread is over here instead?
Why is there a Hurricane Central sub forum if the hurricane thread is over here instead?

HWRF simulated IR satellite at 7:00 PM on Wednesday.

I was thinking the same thing yesterday. I think its a remnant from the old message board and we haven't religiously used it since the switch to WX
SHIPS Intensity forecast for Laura.
http://hurricanes.ral.ucar.edu/realtime ... _ships.txt
It is forecasting Laura as a Category 2 hurricane. Intensity forecast is not reliable.
http://hurricanes.ral.ucar.edu/realtime ... _ships.txt
It is forecasting Laura as a Category 2 hurricane. Intensity forecast is not reliable.
* GFS version *
* ATLANTIC 2020 SHIPS INTENSITY FORECAST *
* IR SAT DATA AVAILABLE, OHC AVAILABLE *
* LAURA AL132020 08/25/20 18 UTC *
TIME (HR) 0 6 12 18 24 36 48 60 72 84 96 108 120 132 144 156 168
V (KT) NO LAND 70 76 80 84 88 90 85 79 71 68 60 59 57 48 37 26 18
V (KT) LAND 70 76 80 84 88 90 48 33 29 28 28 31 29 20 23 15 N/A
V (KT) LGEM 70 76 82 87 90 93 49 34 29 28 28 33 37 37 31 34 33
Storm Type TROP TROP TROP TROP TROP TROP TROP TROP TROP TROP TROP EXTP EXTP EXTP EXTP EXTP EXTP
SHEAR (KT) 8 3 9 12 9 21 25 18 14 23 27 40 59 60 72 74 71
SHEAR ADJ (KT) 6 4 1 1 0 4 4 3 2 6 3 3 0 -7 -10 -7 -12
SHEAR DIR 21 356 306 310 290 263 257 272 263 254 244 241 210 214 230 253 246
SST (C) 30.2 30.3 30.3 30.1 29.9 30.4 31.6 30.8 29.8 30.0 28.6 24.5 19.6 18.9 15.0 12.8 11.3
POT. INT. (KT) 173 172 172 173 169 172 173 172 168 173 151 107 84 81 73 70 68
ADJ. POT. INT. 164 163 163 158 152 159 173 160 144 154 138 99 79 76 70 67 66
200 MB T (C) -50.7 -50.3 -50.6 -50.4 -49.9 -49.5 -49.3 -49.9 -50.7 -51.7 -52.4 -52.0 -51.5 -51.4 -51.5 -52.4 -52.0
200 MB VXT (C) 0.4 0.4 0.5 0.6 0.8 1.4 1.6 1.1 0.6 0.8 0.5 0.6 1.2 1.4 2.1 1.6 1.6
TH_E DEV (C) 12 11 11 10 11 10 12 7 10 5 9 4 2 0 0 0 0
700-500 MB RH 54 57 56 61 61 58 56 55 61 61 53 52 51 56 49 43 49
MODEL VTX (KT) 24 24 25 26 26 26 23 19 14 14 10 13 17 17 17 16 19
850 MB ENV VOR 46 42 17 4 -10 -60 -45 -92 -8 27 111 198 206 179 145 146 121
200 MB DIV 35 51 32 29 38 28 26 23 16 47 40 60 79 72 78 43 18
700-850 TADV 0 -4 -5 0 4 29 2 43 3 42 52 -27 19 -18 -58 -45 -57
LAND (KM) 303 376 401 310 254 30 -258 -527 -653 -721 -372 100 156 86 -22 435 796
LAT (DEG N) 24.3 24.9 25.5 26.4 27.2 29.5 32.1 34.6 36.3 37.4 38.2 39.7 42.1 xx.x xx.x xx.x xx.x
LONG(DEG W) 87.6 88.8 90.0 91.1 92.2 93.4 93.5 92.8 90.3 86.1 80.0 73.0 65.5 xxx.x xxx.x xxx.x xxx.x
STM SPEED (KT) 14 12 13 13 13 12 13 12 15 21 27 29 30 26 24 21 20
HEAT CONTENT 52 63 68 56 39 47 7 6 5 5 3 0 0 0 0 0 0
FORECAST TRACK FROM OFCI INITIAL HEADING/SPEED (DEG/KT):300/ 15 CX,CY: -12/ 8
T-12 MAX WIND: 55 PRESSURE OF STEERING LEVEL (MB): 597 (MEAN=620)
GOES IR BRIGHTNESS TEMP. STD DEV. 50-200 KM RAD: 16.3 (MEAN=14.5)
% GOES IR PIXELS WITH T < -20 C 50-200 KM RAD: 80.0 (MEAN=65.0)
PRELIM RI PROB (DV .GE. 35 KT IN 36 HR): 30.0
INDIVIDUAL CONTRIBUTIONS TO INTENSITY CHANGE
6 12 18 24 36 48 60 72 84 96 108 120 132 144 156 168
------------------------------------------------------------------------------
SAMPLE MEAN CHANGE 1. 2. 3. 4. 6. 8. 9. 10. 11. 12. 12. 13. 14. 14. 15. 16.
SST POTENTIAL 1. 3. 4. 5. 6. 6. 7. 8. 8. 7. 7. 4. 1. -4. -8. -11.
VERTICAL SHEAR MAG 0. 1. 1. 1. 1. -1. -0. 0. -0. -2. -5. -11. -18. -26. -35. -43.
VERTICAL SHEAR ADJ -0. -0. -1. -1. -1. -1. -1. -2. -2. -2. -2. -1. -1. -0. 0. 1.
VERTICAL SHEAR DIR 0. 0. 0. 0. 0. 1. 2. 3. 4. 5. 6. 8. 9. 9. 10. 10.
PERSISTENCE 3. 3. 3. 3. 2. 1. 1. 1. 0. -0. -1. -0. 0. 1. 2. 1.
200/250 MB TEMP. -1. -1. -2. -2. -4. -5. -5. -6. -6. -6. -6. -8. -9. -9. -10. -11.
THETA_E EXCESS 0. 0. 1. 1. 1. 1. 1. 1. 1. 0. 0. -0. -0. -0. -0. 0.
700-500 MB RH -0. -0. -0. -0. -0. -1. -1. -1. -2. -2. -2. -1. -1. -1. -1. -1.
MODEL VTX TENDENCY -0. -0. 0. 0. 0. -3. -10. -17. -19. -25. -22. -16. -16. -16. -16. -14.
850 MB ENV VORTICITY 0. 0. 0. -0. -1. -1. -2. -3. -3. -2. -1. 0. 1. 2. 3. 4.
200 MB DIVERGENCE 0. 0. 0. 0. 0. -0. -0. -0. -0. -0. -0. -0. -0. -1. -1. -1.
850-700 T ADVEC 0. -0. -0. -0. 0. 0. 1. 1. 1. 1. 1. 1. 0. 0. 0. -0.
ZONAL STORM MOTION -0. -0. 0. 0. 1. 1. 1. 1. 2. 2. 3. 3. 3. 3. 3. 3.
STEERING LEVEL PRES 0. 0. 0. 0. 0. 0. 0. 0. 0. 0. 0. 0. 0. 0. 0. 0.
DAYS FROM CLIM. PEAK 0. -0. -0. -0. -0. 0. 0. -0. -0. -0. -0. -0. -0. -0. -0. -0.
GOES PREDICTORS 0. 0. 0. 0. 1. 1. 1. 2. 2. 2. 2. 2. 1. 1. 1. 1.
OCEAN HEAT CONTENT 0. 0. 0. 0. 0. 0. -0. -0. -0. -0. -0. -0. -0. -0. -0. -0.
RI POTENTIAL 1. 2. 4. 6. 8. 7. 5. 3. 1. -1. -3. -4. -5. -5. -5. -5.
------------------------------------------------------------------------------
TOTAL CHANGE 6. 10. 14. 18. 20. 15. 9. 1. -2. -10. -11. -13. -22. -33. -44. -52.
CURRENT MAX WIND (KT): 70. LAT, LON: 24.3 87.6
** 2020 ATLANTIC RI INDEX AL132020 LAURA 08/25/20 18 UTC **
(SHIPS-RII PREDICTOR TABLE for 30 KT OR MOREMAXIMUM WIND INCREASE IN NEXT 24-h)
Predictor Value RI Predictor Range Scaled Value(0-1) % Contribution
12 HR PERSISTENCE (KT) : 15.0 -49.5 to 33.0 0.78 11.7
850-200 MB SHEAR (KT) : 8.4 30.1 to 2.3 0.78 4.5
HEAT CONTENT (KJ/CM2) : 55.6 0.0 to 151.8 0.37 2.0
STD DEV OF IR BR TEMP : 16.3 36.6 to 2.8 0.60 3.8
MAXIMUM WIND (KT) : 70.0 22.5 to 137.5 0.88 2.9
2nd PC OF IR BR TEMP : 1.4 2.9 to -2.9 0.25 1.0
BL DRY-AIR FLUX (W/M2) : 363.8 895.4 to -55.0 0.56 2.2
POT = MPI-VMAX (KT) : 90.2 27.5 to 139.6 0.56 0.8
D200 (10**7s-1) : 37.0 -29.7 to 185.9 0.31 0.3
%area of TPW <45 mm upshear : 6.0 100.0 to 0.0 0.94 0.4
SHIPS Prob RI for 20kt/ 12hr RI threshold= 22% is 4.3 times climatological mean ( 5.0%)
SHIPS Prob RI for 25kt/ 24hr RI threshold= 42% is 3.9 times climatological mean (10.9%)
SHIPS Prob RI for 30kt/ 24hr RI threshold= 29% is 4.3 times climatological mean ( 6.9%)
SHIPS Prob RI for 35kt/ 24hr RI threshold= 24% is 6.3 times climatological mean ( 3.9%)
SHIPS Prob RI for 40kt/ 24hr RI threshold= 15% is 6.1 times climatological mean ( 2.5%)
SHIPS Prob RI for 45kt/ 36hr RI threshold= 18% is 3.9 times climatological mean ( 4.6%)
SHIPS Prob RI for 55kt/ 48hr RI threshold= 13% is 2.7 times climatological mean ( 4.6%)
SHIPS Prob RI for 65kt/ 72hr RI threshold= 15% is 2.8 times climatological mean ( 5.2%)
Matrix of RI probabilities
------------------------------------------------------------------------------
RI (kt / h) | 20/12 | 25/24 | 30/24 | 35/24 | 40/24 | 45/36 | 55/48 |65/72
------------------------------------------------------------------------------
SHIPS-RII: 21.7% 42.0% 29.4% 24.4% 15.3% 17.9% 12.6% 14.8%
Logistic: 14.0% 35.5% 24.9% 26.4% 15.5% 26.5% 15.2% 2.0%
Bayesian: 21.7% 37.4% 14.7% 1.8% 0.3% 4.3% 0.2% 0.0%
Consensus: 19.2% 38.3% 23.0% 17.5% 10.4% 16.2% 9.4% 5.6%
DTOPS: 32.0% 73.0% 41.0% 17.0% 2.0% 0.0% 0.0% 0.0%
## ANNULAR HURRICANE INDEX (AHI) AL132020 LAURA 08/25/20 18 UTC ##
## STORM NOT ANNULAR, SCREENING STEP FAILED, NPASS=3 NFAIL=4 ##
## AHI= 0 (AHI OF 100 IS BEST FIT TO ANN. STRUC., 1 IS MARGINAL, 0 IS NOT ANNULAR) ##
** PROBLTY OF AT LEAST 1 SCNDRY EYEWL FORMTN EVENT AL132020 LAURA 08/25/2020 18 UTC **
TIME(HR) 0-12 12-24(0-24) 24-36(0-36) 36-48(0-48)
CLIMO(%) 4 7( 11) 11( 21) 12( 30) <-- PROB BASED ON INTENSITY ONLY
PROB(%) 1 1( 2) 4( 6) 0( 6) <-- FULL MODEL PROB (RAN NORMALLY)
** DSHIPS INTENSITY FORECAST ADJUSTED RELATIVE TO ONSET OF ERC WEAKENING PHASE **
TIME (HR) 0 6 12 18 24 36 48 60 72 84 96 108 120 132 144 156 168
>24HR AGO (DSHIPS) 70 76 80 84 88 90 48 33 29 28 28 31 29 20 23 15 DIS
18HR AGO 70 69 73 77 81 83 41 26 22 21 21 24 22 DIS DIS DIS DIS
12HR AGO 70 67 66 70 74 76 34 19 15 DIS DIS DIS DIS DIS DIS DIS DIS
6HR AGO 70 64 61 60 64 66 24 DIS DIS DIS DIS DIS DIS DIS DIS DIS DIS
NOW CURRENT INTENSITY < 83 KT
IN 6HR INTENSITY IN 6HR < 83 KT
IN 12HR INTENSITY IN 12HR < 83 KT
-
TexasBreeze
- Posts: 942
- Joined: Sun Sep 26, 2010 4:46 pm
- Location: NW Houston, TX
- Contact:
Hurricane Central is mainly used for non local area threats and future system development potential.
If Laura comes ashore near the TX/LA border, what kinds of bad weather will the north Houston suburbs experience? If any?
-
weatherguy425
- Pro Met

- Posts: 830
- Joined: Wed Feb 03, 2010 7:45 pm
- Location: Atlanta, Georgia
- Contact:
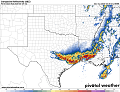
Something to keep an eye on that others have mentioned.
- Attachments
-
-
-
is there still a chance she goes to Lake Charles or east of there?
Has the recon data started coming in? Any idea when? Thanks in advance.
-
weatherguy425
- Pro Met
- Posts: 830
- Joined: Wed Feb 03, 2010 7:45 pm
- Location: Atlanta, Georgia
- Contact:
Center is, technically, still south of 25°N; slightly south of where it appears on satellite. RECON just missed the center, but looking like another 1-2 MB pressure drop since last pass; 981 or 982 MB.
EDIT: Drop had higher winds, 15 KT, estimated pressure may be 979 or 980 MB.
- Attachments
-
Gracious. Wishing everyone in the path much safety!!!
Starting to feel better about the trends. 
I am as well, but won’t really feel comfortable until tomorrow morning. Lots can change and the center can jog in any direction. Just praying it keeps east of here. I’m prepared for a direct hit as best as possible but my wife and I are expecting our baby tonight/tomorrow so hoping to not deal with the outcome of this storm afterwards.