
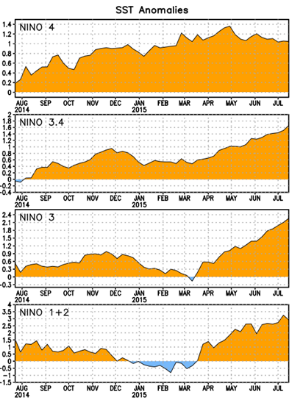
This Week's ENSO
Niño 4 1.1ºC
Niño 3.4 1.3ºC
Niño 3 1.5ºC
Niño 1+2 2.6ºC
http://www.cpc.noaa.gov/products/analys ... ts-web.pdf
All regions warmed except for Region 4, which cooled.
ENSO Updates
-
Ptarmigan
- Statistical Specialist

- Posts: 4521
- Joined: Wed Feb 03, 2010 7:20 pm
- Contact:
-
Ptarmigan
- Statistical Specialist
- Posts: 4521
- Joined: Wed Feb 03, 2010 7:20 pm
- Contact:
Latest Southern Oscillation Index values
https://www.longpaddock.qld.gov.au/seas ... tionindex/
Average for last 30 days 0.74
Average for last 90 days -6.38
Daily contribution to SOI calculation 10.75
SOI is up from last week.
ENSO Precipitation Index (ESPI)
http://trmm.gsfc.nasa.gov//trmm_rain/Ev ... y_day.html
Last 30 Days 0.85
ESPI is going up, which is sign of El Nino.
-
Ptarmigan
- Statistical Specialist
- Posts: 4521
- Joined: Wed Feb 03, 2010 7:20 pm
- Contact:
This Week's ENSO
Niño 4 1.1ºC
Niño 3.4 1.4ºC
Niño 3 1.8ºC
Niño 1+2 2.7ºC
http://www.cpc.noaa.gov/products/analys ... ts-web.pdf
All regions have warmed except Region 4.
Niño 4 1.1ºC
Niño 3.4 1.4ºC
Niño 3 1.8ºC
Niño 1+2 2.7ºC
http://www.cpc.noaa.gov/products/analys ... ts-web.pdf
All regions have warmed except Region 4.
-
Ptarmigan
- Statistical Specialist
- Posts: 4521
- Joined: Wed Feb 03, 2010 7:20 pm
- Contact:
Latest Southern Oscillation Index values
https://www.longpaddock.qld.gov.au/seas ... tionindex/
Average for last 30 days 0.87
Average for last 90 days -6.54
Daily contribution to SOI calculation -28.40
SOI is down from last week.
ENSO Precipitation Index (ESPI)
http://trmm.gsfc.nasa.gov//trmm_rain/Ev ... y_day.html
Last 30 Days 0.26
ESPI is going down.
-
Ptarmigan
- Statistical Specialist
- Posts: 4521
- Joined: Wed Feb 03, 2010 7:20 pm
- Contact:
An Eastern Equatorial El Nino is developing.
-
Ptarmigan
- Statistical Specialist
- Posts: 4521
- Joined: Wed Feb 03, 2010 7:20 pm
- Contact:
This Week's ENSO
Niño 4 1.1ºC
Niño 3.4 1.4ºC
Niño 3 1.9ºC
Niño 1+2 2.6ºC
http://www.cpc.noaa.gov/products/analys ... ts-web.pdf
Region 1+2 has cooled, while Region 3 has warmed. Region 3.4 and 4 have stayed the same.
Niño 4 1.1ºC
Niño 3.4 1.4ºC
Niño 3 1.9ºC
Niño 1+2 2.6ºC
http://www.cpc.noaa.gov/products/analys ... ts-web.pdf
Region 1+2 has cooled, while Region 3 has warmed. Region 3.4 and 4 have stayed the same.
-
Ptarmigan
- Statistical Specialist
- Posts: 4521
- Joined: Wed Feb 03, 2010 7:20 pm
- Contact:
Latest Southern Oscillation Index values
https://www.longpaddock.qld.gov.au/seas ... tionindex/
Average for last 30 days -9.45
Average for last 90 days -8.74
Daily contribution to SOI calculation -28.47
SOI is down from last week.
ENSO Precipitation Index (ESPI)
http://trmm.gsfc.nasa.gov//trmm_rain/Ev ... y_day.html
Last 30 Days 0.73
ESPI is going up.
-
Ptarmigan
- Statistical Specialist
- Posts: 4521
- Joined: Wed Feb 03, 2010 7:20 pm
- Contact:
This Week's ENSO
Niño 4 1.1ºC
Niño 3.4 1.5ºC
Niño 3 2.1ºC
Niño 1+2 3.3ºC
http://www.cpc.noaa.gov/products/analys ... ts-web.pdf
Really warmed up, except for Region 4.
Niño 4 1.1ºC
Niño 3.4 1.5ºC
Niño 3 2.1ºC
Niño 1+2 3.3ºC
http://www.cpc.noaa.gov/products/analys ... ts-web.pdf
Really warmed up, except for Region 4.
-
srainhoutx

- Site Admin

- Posts: 19700
- Joined: Tue Feb 02, 2010 2:32 pm
- Location: Maggie Valley, NC
- Contact:
From Phil Klotzbach via twitter yesterday:
Philip Klotzbach @philklotzbach · 19h19 hours ago
Weekly Nino 3 index at 2.3C. Only two El Ninos since 1950 have had monthly Nino 3 values >= 2.3C ('82-'83, '97-'98).
Philip Klotzbach @philklotzbach · 19h19 hours ago
Weekly Nino 3 index at 2.3C. Only two El Ninos since 1950 have had monthly Nino 3 values >= 2.3C ('82-'83, '97-'98).
Carla/Alicia/Jerry(In The Eye)/Michelle/Charley/Ivan/Dennis/Katrina/Rita/Wilma/Humberto/Ike/Harvey
Member: National Weather Association
Facebook.com/Weather Infinity
Twitter @WeatherInfinity
Member: National Weather Association
Facebook.com/Weather Infinity
Twitter @WeatherInfinity
-
Ptarmigan
- Statistical Specialist
- Posts: 4521
- Joined: Wed Feb 03, 2010 7:20 pm
- Contact:
This Week's ENSO
Niño 4 1.0ºC
Niño 3.4 1.7ºC
Niño 3 2.3ºC
Niño 1+2 2.9ºC
http://www.cpc.noaa.gov/products/analys ... ts-web.pdf
Region 1+2 and 4 have cooled. Region 3 and 3.4 have warmed.
Niño 4 1.0ºC
Niño 3.4 1.7ºC
Niño 3 2.3ºC
Niño 1+2 2.9ºC
http://www.cpc.noaa.gov/products/analys ... ts-web.pdf
Region 1+2 and 4 have cooled. Region 3 and 3.4 have warmed.
-
Ptarmigan
- Statistical Specialist
- Posts: 4521
- Joined: Wed Feb 03, 2010 7:20 pm
- Contact:
This Week's ENSO
Niño 4 1.0ºC
Niño 3.4 1.6ºC
Niño 3 2.1ºC
Niño 1+2 2.3ºC
http://www.cpc.noaa.gov/products/analys ... ts-web.pdf
Region 1+2 has cooled. Region 3 and 3.4 have warmed, while Region 4 has not changed.
Niño 4 1.0ºC
Niño 3.4 1.6ºC
Niño 3 2.1ºC
Niño 1+2 2.3ºC
http://www.cpc.noaa.gov/products/analys ... ts-web.pdf
Region 1+2 has cooled. Region 3 and 3.4 have warmed, while Region 4 has not changed.
-
Ptarmigan
- Statistical Specialist
- Posts: 4521
- Joined: Wed Feb 03, 2010 7:20 pm
- Contact:
Latest Southern Oscillation Index values
https://www.longpaddock.qld.gov.au/seas ... tionindex/
Average for last 30 days -13.66
Average for last 90 days -11.85
Daily contribution to SOI calculation -17.17
SOI is down from last week.
ENSO Precipitation Index (ESPI)
http://trmm.gsfc.nasa.gov//trmm_rain/Ev ... y_day.html
Last 30 Days 3.31
ESPI is going up.
-
Ptarmigan
- Statistical Specialist
- Posts: 4521
- Joined: Wed Feb 03, 2010 7:20 pm
- Contact:
Why a ‘super El Niño’ could still be a bust for California drought relief
http://www.washingtonpost.com/blogs/cap ... ht-relief/
The warm water off the coast of Alaska could be a factor.
http://www.washingtonpost.com/blogs/cap ... ht-relief/
The warm water off the coast of Alaska could be a factor.
-
Ptarmigan
- Statistical Specialist
- Posts: 4521
- Joined: Wed Feb 03, 2010 7:20 pm
- Contact:
This Week's ENSO
Niño 4 0.9ºC
Niño 3.4 1.9ºC
Niño 3 2.3ºC
Niño 1+2 2.6ºC
http://www.cpc.noaa.gov/products/analys ... ts-web.pdf
It is really starting to warm up. Only Region 4 has cooled.
Niño 4 0.9ºC
Niño 3.4 1.9ºC
Niño 3 2.3ºC
Niño 1+2 2.6ºC
http://www.cpc.noaa.gov/products/analys ... ts-web.pdf
It is really starting to warm up. Only Region 4 has cooled.
-
Ptarmigan
- Statistical Specialist
- Posts: 4521
- Joined: Wed Feb 03, 2010 7:20 pm
- Contact:
Latest Southern Oscillation Index values
https://www.longpaddock.qld.gov.au/seas ... tionindex/
Average for last 30 days -18.35
Average for last 90 days -12.74
Daily contribution to SOI calculation -4.67
SOI has gone up. Overall SOI average is negative.
ENSO Precipitation Index (ESPI)
http://trmm.gsfc.nasa.gov//trmm_rain/Ev ... y_day.html
Last 30 Days 2.78
ESPI is down, but high.
-
srainhoutx
- Site Admin
- Posts: 19700
- Joined: Tue Feb 02, 2010 2:32 pm
- Location: Maggie Valley, NC
- Contact:
The Climate Prediction Center in their Blog released today is suggesting a Strong El Nino is possible going into the Fall/Winter Season. Worth the read for those wanting to get a glimpse of what a Strong El Nino could mean for Texas, The Gulf Coastal States and the SE United States. Hint...looks wet and chilly with a very active Southern branch of the jet stream directing the storm track very far South and a growing potential for sub tropical jet activity across our Region.
https://www.climate.gov/news-features/b ... alidocious
https://www.climate.gov/news-features/b ... alidocious
Carla/Alicia/Jerry(In The Eye)/Michelle/Charley/Ivan/Dennis/Katrina/Rita/Wilma/Humberto/Ike/Harvey
Member: National Weather Association
Facebook.com/Weather Infinity
Twitter @WeatherInfinity
Member: National Weather Association
Facebook.com/Weather Infinity
Twitter @WeatherInfinity
-
Ptarmigan
- Statistical Specialist
- Posts: 4521
- Joined: Wed Feb 03, 2010 7:20 pm
- Contact:
This Week's ENSO
Niño 4 0.9ºC
Niño 3.4 2.0ºC
Niño 3 2.2ºC
Niño 1+2 2.0ºC
http://www.cpc.noaa.gov/products/analys ... ts-web.pdf
Region 1+2 and 3 have cooled, while Region 3.4 has warmed.
Niño 4 0.9ºC
Niño 3.4 2.0ºC
Niño 3 2.2ºC
Niño 1+2 2.0ºC
http://www.cpc.noaa.gov/products/analys ... ts-web.pdf
Region 1+2 and 3 have cooled, while Region 3.4 has warmed.
-
Ptarmigan
- Statistical Specialist
- Posts: 4521
- Joined: Wed Feb 03, 2010 7:20 pm
- Contact:
Latest Southern Oscillation Index values
https://www.longpaddock.qld.gov.au/seas ... tionindex/
Average for last 30 days -19.20
Average for last 90 days -12.18
Daily contribution to SOI calculation -17.06
SOI has gone down. Overall SOI average is negative.
ENSO Precipitation Index (ESPI)
http://trmm.gsfc.nasa.gov//trmm_rain/Ev ... y_day.html
Last 30 Days 2.54
ESPI is down, but high.
-
Ptarmigan
- Statistical Specialist
- Posts: 4521
- Joined: Wed Feb 03, 2010 7:20 pm
- Contact:
This Week's ENSO
Niño 4 1.1ºC
Niño 3.4 2.1ºC
Niño 3 2.2ºC
Niño 1+2 1.7ºC
http://www.cpc.noaa.gov/products/analys ... ts-web.pdf
Region 1+2 has cooled. Region 3 remains the same. Region 3.4 and 4 have warmed.
Niño 4 1.1ºC
Niño 3.4 2.1ºC
Niño 3 2.2ºC
Niño 1+2 1.7ºC
http://www.cpc.noaa.gov/products/analys ... ts-web.pdf
Region 1+2 has cooled. Region 3 remains the same. Region 3.4 and 4 have warmed.
-
Ptarmigan
- Statistical Specialist
- Posts: 4521
- Joined: Wed Feb 03, 2010 7:20 pm
- Contact:
Latest Southern Oscillation Index values
https://www.longpaddock.qld.gov.au/seas ... tionindex/
Average for last 30 days -20.23
Average for last 90 days -12.84
Daily contribution to SOI calculation -7.10
SOI has risen. Overall SOI average is negative.
ENSO Precipitation Index (ESPI)
http://trmm.gsfc.nasa.gov//trmm_rain/Ev ... y_day.html
Last 30 Days 1.94
ESPI is down, but high.