
Latest Southern Oscillation Index values
https://www.longpaddock.qld.gov.au/seas ... tionindex/
Average for last 30 days -6.0
Average for last 90 days -6.6
Daily contribution to SOI calculation 16.3
ENSO Updates
-
Ptarmigan
- Statistical Specialist

- Posts: 4521
- Joined: Wed Feb 03, 2010 7:20 pm
- Contact:
-
Ptarmigan
- Statistical Specialist
- Posts: 4521
- Joined: Wed Feb 03, 2010 7:20 pm
- Contact:
This Week's ENSO
Niño 4 1.0ºC
Niño 3.4 0.5ºC
Niño 3 0.3ºC
Niño 1+2 -0.1ºC
http://www.cpc.noaa.gov/products/analys ... ts-web.pdf
Region 1+2 and 4 have warmed, while Region 3 and 3.4 are unchanged.
Niño 4 1.0ºC
Niño 3.4 0.5ºC
Niño 3 0.3ºC
Niño 1+2 -0.1ºC
http://www.cpc.noaa.gov/products/analys ... ts-web.pdf
Region 1+2 and 4 have warmed, while Region 3 and 3.4 are unchanged.
-
Ptarmigan
- Statistical Specialist
- Posts: 4521
- Joined: Wed Feb 03, 2010 7:20 pm
- Contact:
Latest Southern Oscillation Index values
https://www.longpaddock.qld.gov.au/seas ... tionindex/
Average for last 30 days -0.7
Average for last 90 days -5.9
Daily contribution to SOI calculation -9.4
SOI dropped from last week. It was positive and now negative as of today.
ENSO Precipitation Index (ESPI)
http://trmm.gsfc.nasa.gov//trmm_rain/Ev ... y_day.html
Last 30 Days -0.07
-
Ptarmigan
- Statistical Specialist
- Posts: 4521
- Joined: Wed Feb 03, 2010 7:20 pm
- Contact:
This Week's ENSO
Niño 4 1.2ºC
Niño 3.4 0.6ºC
Niño 3 0.1ºC
Niño 1+2 -0.1ºC
http://www.cpc.noaa.gov/products/analys ... ts-web.pdf
Region 1+2 has not changed, while Region 3 has cooled. Region 3.4 and 4 has warmed.
Niño 4 1.2ºC
Niño 3.4 0.6ºC
Niño 3 0.1ºC
Niño 1+2 -0.1ºC
http://www.cpc.noaa.gov/products/analys ... ts-web.pdf
Region 1+2 has not changed, while Region 3 has cooled. Region 3.4 and 4 has warmed.
-
Ptarmigan
- Statistical Specialist
- Posts: 4521
- Joined: Wed Feb 03, 2010 7:20 pm
- Contact:
March 2015 ENSO discussion: El Niño is here
http://www.climate.gov/news-features/bl ... -niño-here
Over the last several months, we’ve seen warmer-than-average sea surface temperatures (SSTs) in the tropical Pacific, including the Niño3.4 region, which we track as one indicator of El Niño. The seasonal Niño3.4 Index has been at or above 0.5°C since September, and the most recent weekly Niño3.4 index was +0.6°C.
The El Niño/Southern Oscillation (ENSO) is a coupled phenomenon, though, so we also monitor the atmosphere for signs that it is responding to those positive SST anomalies. For the last few months, we’ve been seeing some suggestions of borderline atmospheric El Niño conditions, but until this month we were below that borderline. This month, we’ve finally crept above it, and thus NOAA is declaring the onset of El Niño conditions.
El Nino has been declared.
-
Ptarmigan
- Statistical Specialist
- Posts: 4521
- Joined: Wed Feb 03, 2010 7:20 pm
- Contact:
How warm pool compares this year to last year at this time.


-
Ptarmigan
- Statistical Specialist
- Posts: 4521
- Joined: Wed Feb 03, 2010 7:20 pm
- Contact:
This Week's ENSO
Niño 4 1.1ºC
Niño 3.4 0.5ºC
Niño 3 0.1ºC
Niño 1+2 -0.5ºC
http://www.cpc.noaa.gov/products/analys ... ts-web.pdf
All regions have cooled, except Region 3.
Niño 4 1.1ºC
Niño 3.4 0.5ºC
Niño 3 0.1ºC
Niño 1+2 -0.5ºC
http://www.cpc.noaa.gov/products/analys ... ts-web.pdf
All regions have cooled, except Region 3.
-
Ptarmigan
- Statistical Specialist
- Posts: 4521
- Joined: Wed Feb 03, 2010 7:20 pm
- Contact:
Latest Southern Oscillation Index values
https://www.longpaddock.qld.gov.au/seas ... tionindex/
Average for last 30 days -0.4
Average for last 90 days -5.8
Daily contribution to SOI calculation -22.3
December -7.6
January -8.7
February -0.5
ENSO Precipitation Index (ESPI)
http://trmm.gsfc.nasa.gov//trmm_rain/Ev ... y_day.html
Last 30 Days -0.09
-
Ptarmigan
- Statistical Specialist
- Posts: 4521
- Joined: Wed Feb 03, 2010 7:20 pm
- Contact:
This Week's ENSO
Niño 4 1.0ºC
Niño 3.4 0.5ºC
Niño 3 -0.2ºC
Niño 1+2 -0.3ºC
http://www.cpc.noaa.gov/products/analys ... ts-web.pdf
Region 1+2 has warmed. Region 3.4 is unchanged. The rest have cooled.
Niño 4 1.0ºC
Niño 3.4 0.5ºC
Niño 3 -0.2ºC
Niño 1+2 -0.3ºC
http://www.cpc.noaa.gov/products/analys ... ts-web.pdf
Region 1+2 has warmed. Region 3.4 is unchanged. The rest have cooled.
-
Ptarmigan
- Statistical Specialist
- Posts: 4521
- Joined: Wed Feb 03, 2010 7:20 pm
- Contact:
Latest Southern Oscillation Index values
https://www.longpaddock.qld.gov.au/seas ... tionindex/
Average for last 30 days -3.0
Average for last 90 days -6.7
Daily contribution to SOI calculation -35.2
SOI has dropped from last week thanks to a strong Madden-Julian Oscillation (MJO).
ENSO Precipitation Index (ESPI)
http://trmm.gsfc.nasa.gov//trmm_rain/Ev ... y_day.html
Last 30 Days 0.17
El Nino is coming folks.
-
Ptarmigan
- Statistical Specialist
- Posts: 4521
- Joined: Wed Feb 03, 2010 7:20 pm
- Contact:
Tropical cyclone activity may lead to further ocean warming
http://www.bom.gov.au/climate/enso/#tabs=Overview
Issued on 17 March 2015 | Product Code IDCKGEWW00
The past fortnight has seen unusual conditions in the tropical Pacific, which may increase the chance of El Niño in 2015.
In the western Pacific, severe tropical cyclone Pam and tropical storm Bavi* straddled the equator, producing one of the strongest reversals in the trade winds in recent years. This change is expected to increase the already warm sub-surface temperatures currently observed in the tropical Pacific Ocean, which may in turn raise tropical Pacific Ocean surface temperatures in the coming months. However, it remains too early to say whether the reversal in the trade winds is a short term fluctuation or the beginning of a sustained trend.
International models surveyed by the Bureau have strengthened their outlooks for the likelihood of El Niño, with all eight models suggesting ocean temperatures will exceed El Niño thresholds by mid-year. However, model outlooks spanning the traditional ENSO transition period, February to May, generally have lower accuracy than outlooks made at other times of year.
El Nino is more likely for 2015.

Most forecast model have El Nino. Some have an extremely strong El Nino like EURO, NASA, and METEO. The average is for a strong El Nino by this summer.
http://www.bom.gov.au/climate/enso/#tabs=Overview
Issued on 17 March 2015 | Product Code IDCKGEWW00
The past fortnight has seen unusual conditions in the tropical Pacific, which may increase the chance of El Niño in 2015.
In the western Pacific, severe tropical cyclone Pam and tropical storm Bavi* straddled the equator, producing one of the strongest reversals in the trade winds in recent years. This change is expected to increase the already warm sub-surface temperatures currently observed in the tropical Pacific Ocean, which may in turn raise tropical Pacific Ocean surface temperatures in the coming months. However, it remains too early to say whether the reversal in the trade winds is a short term fluctuation or the beginning of a sustained trend.
International models surveyed by the Bureau have strengthened their outlooks for the likelihood of El Niño, with all eight models suggesting ocean temperatures will exceed El Niño thresholds by mid-year. However, model outlooks spanning the traditional ENSO transition period, February to May, generally have lower accuracy than outlooks made at other times of year.
El Nino is more likely for 2015.
Most forecast model have El Nino. Some have an extremely strong El Nino like EURO, NASA, and METEO. The average is for a strong El Nino by this summer.
-
Ptarmigan
- Statistical Specialist
- Posts: 4521
- Joined: Wed Feb 03, 2010 7:20 pm
- Contact:
This Week's ENSO
Niño 4 1.2ºC
Niño 3.4 0.6ºC
Niño 3 0.2ºC
Niño 1+2 0.0ºC
http://www.cpc.noaa.gov/products/analys ... ts-web.pdf
All regions have warmed.
Niño 4 1.2ºC
Niño 3.4 0.6ºC
Niño 3 0.2ºC
Niño 1+2 0.0ºC
http://www.cpc.noaa.gov/products/analys ... ts-web.pdf
All regions have warmed.
-
Ptarmigan
- Statistical Specialist
- Posts: 4521
- Joined: Wed Feb 03, 2010 7:20 pm
- Contact:
Latest Southern Oscillation Index values
https://www.longpaddock.qld.gov.au/seas ... tionindex/
Average for last 30 days -10.7
Average for last 90 days -7.1
Daily contribution to SOI calculation -1.1
SOI went up from last week.
ENSO Precipitation Index (ESPI)
http://trmm.gsfc.nasa.gov//trmm_rain/Ev ... y_day.html
Last 30 Days 0.56
https://www.longpaddock.qld.gov.au/seas ... tionindex/
Average for last 30 days -10.7
Average for last 90 days -7.1
Daily contribution to SOI calculation -1.1
SOI went up from last week.
ENSO Precipitation Index (ESPI)
http://trmm.gsfc.nasa.gov//trmm_rain/Ev ... y_day.html
Last 30 Days 0.56
-
Ptarmigan
- Statistical Specialist
- Posts: 4521
- Joined: Wed Feb 03, 2010 7:20 pm
- Contact:
This Week's ENSO
Niño 4 1.1ºC
Niño 3.4 0.6ºC
Niño 3 0.6ºC
Niño 1+2 1.2ºC
http://www.cpc.noaa.gov/products/analys ... ts-web.pdf
Region 1+2 warmed up a lot. Region 3 warmed up as well. Region 3.4 is the same, while Region 4 has slightly cooled.
Niño 4 1.1ºC
Niño 3.4 0.6ºC
Niño 3 0.6ºC
Niño 1+2 1.2ºC
http://www.cpc.noaa.gov/products/analys ... ts-web.pdf
Region 1+2 warmed up a lot. Region 3 warmed up as well. Region 3.4 is the same, while Region 4 has slightly cooled.
-
Ptarmigan
- Statistical Specialist
- Posts: 4521
- Joined: Wed Feb 03, 2010 7:20 pm
- Contact:
Latest Southern Oscillation Index values
https://www.longpaddock.qld.gov.au/seas ... tionindex/
Average for last 30 days -10.7
Average for last 90 days -6.8
Daily contribution to SOI calculation -8.5
SOI went up from last week.
ENSO Precipitation Index (ESPI)
http://trmm.gsfc.nasa.gov//trmm_rain/Ev ... y_day.html
Last 30 Days 0.86
https://www.longpaddock.qld.gov.au/seas ... tionindex/
Average for last 30 days -10.7
Average for last 90 days -6.8
Daily contribution to SOI calculation -8.5
SOI went up from last week.
ENSO Precipitation Index (ESPI)
http://trmm.gsfc.nasa.gov//trmm_rain/Ev ... y_day.html
Last 30 Days 0.86
-
Ptarmigan
- Statistical Specialist
- Posts: 4521
- Joined: Wed Feb 03, 2010 7:20 pm
- Contact:
This Week's ENSO
Niño 4 1.1ºC
Niño 3.4 0.7ºC
Niño 3 0.6ºC
Niño 1+2 1.4ºC
http://www.cpc.noaa.gov/products/analys ... ts-web.pdf
Region 1+2 and 3.4 warmed, while Region 3 and 4 have unchanged.
Niño 4 1.1ºC
Niño 3.4 0.7ºC
Niño 3 0.6ºC
Niño 1+2 1.4ºC
http://www.cpc.noaa.gov/products/analys ... ts-web.pdf
Region 1+2 and 3.4 warmed, while Region 3 and 4 have unchanged.
-
Ptarmigan
- Statistical Specialist
- Posts: 4521
- Joined: Wed Feb 03, 2010 7:20 pm
- Contact:
Latest Southern Oscillation Index values
https://www.longpaddock.qld.gov.au/seas ... tionindex/
Average for last 30 days -10.3
Average for last 90 days -6.4
Daily contribution to SOI calculation 8.3
SOI went up from last week.
ENSO Precipitation Index (ESPI)
http://trmm.gsfc.nasa.gov//trmm_rain/Ev ... y_day.html
Last 30 Days 0.84
https://www.longpaddock.qld.gov.au/seas ... tionindex/
Average for last 30 days -10.3
Average for last 90 days -6.4
Daily contribution to SOI calculation 8.3
SOI went up from last week.
ENSO Precipitation Index (ESPI)
http://trmm.gsfc.nasa.gov//trmm_rain/Ev ... y_day.html
Last 30 Days 0.84
-
Ptarmigan
- Statistical Specialist
- Posts: 4521
- Joined: Wed Feb 03, 2010 7:20 pm
- Contact:
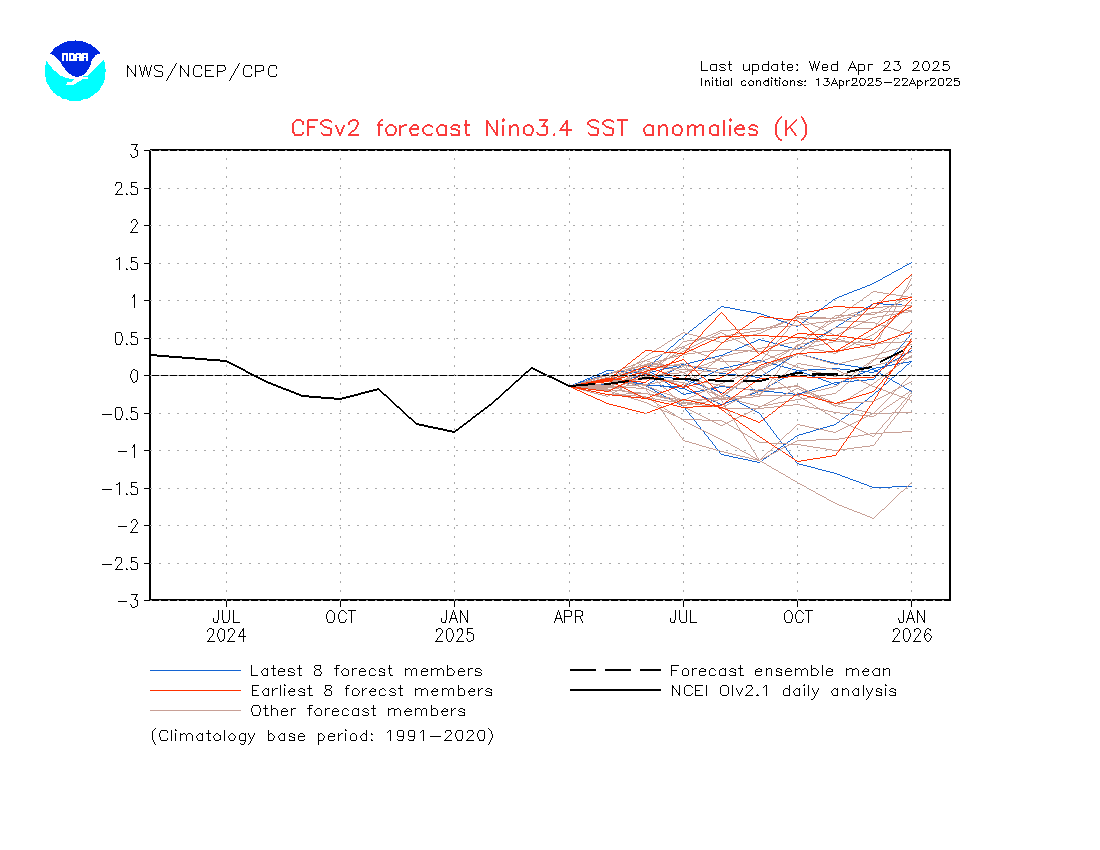
CFSv2 is forecasting a strong El Nino later this year.
-
Ptarmigan
- Statistical Specialist
- Posts: 4521
- Joined: Wed Feb 03, 2010 7:20 pm
- Contact:
This Week's ENSO
Niño 4 1.2ºC
Niño 3.4 0.7ºC
Niño 3 0.5ºC
Niño 1+2 0.9ºC
http://www.cpc.noaa.gov/products/analys ... ts-web.pdf
Region 1+2 and 3 cooled. Region 3.4 is the same, while 4 has warmed.
Niño 4 1.2ºC
Niño 3.4 0.7ºC
Niño 3 0.5ºC
Niño 1+2 0.9ºC
http://www.cpc.noaa.gov/products/analys ... ts-web.pdf
Region 1+2 and 3 cooled. Region 3.4 is the same, while 4 has warmed.
-
Ptarmigan
- Statistical Specialist
- Posts: 4521
- Joined: Wed Feb 03, 2010 7:20 pm
- Contact:
Latest Southern Oscillation Index values
https://www.longpaddock.qld.gov.au/seas ... tionindex/
Average for last 30 days -8.4
Average for last 90 days -7.1
Daily contribution to SOI calculation 1.7
SOI went up from last week.
ENSO Precipitation Index (ESPI)
http://trmm.gsfc.nasa.gov//trmm_rain/Ev ... y_day.html
Last 30 Days 0.89
https://www.longpaddock.qld.gov.au/seas ... tionindex/
Average for last 30 days -8.4
Average for last 90 days -7.1
Daily contribution to SOI calculation 1.7
SOI went up from last week.
ENSO Precipitation Index (ESPI)
http://trmm.gsfc.nasa.gov//trmm_rain/Ev ... y_day.html
Last 30 Days 0.89